Process improvement (also called business process re-engineering) is a systematic approach to improving a process. It’s a way to find out and then resolve the problems that affect the productivity and efficiency of a process. It is the systematic effort to understand every aspect of a process in order to reduce rework, variation and needless complexity. Process improvement involves documentation, measurement and analysis for the purpose of improving the functioning of a process. Team SW, with critical inputs from Amit Anand, a Post-Graduate Diploma holder in Garment Manufacturing from NIFT with work experience of about four years in the field of apparel merchandising and marketing, traces the concept of business process re-engineering and its various components for greater productivity and efficiency in the process.
A business process is a series of actions which are repeatedly performed to transform inputs into outputs. Inputs come from a supplier of the process, and outputs go to the customer of the process. The outcome (benefit) is the degree to which outputs meet the needs and expectations of the customer.
Like any other manufacturing organization, in a garment manufacturing organization too, processes run in various departments. These processes can broadly be classified into pre-production, in-production and post-production processes. For instance, production and quality departments have a set of processes that they conduct for every new style that is loaded into the production lines. Other departments, like sourcing, sampling and merchandising department also have their own processes. Processes help the departments achieve their targets. However, most of the times, people in a department get so much engrossed in their day-to-day work that they fail to think about the effectiveness and efficiency of processes that run in their department. Therefore, though they carry out the processes as their normal job function, they even fail to ponder on whether there was a need to redesign the process and if yes, how it could be redesigned. Process improvement can be achieved by a four-step exercise: Process/Cost centre matrix; Key process map; Analyze the process; and Re-designing the process.
|
Processes |
Cost Centres |
|
Store |
Sampling |
Merchandising |
Sewing |
Finish |
Dispatch |
|
Pre-production sample making |
Y |
Y |
Y |
Y |
|
1 |
Style specification received from merchandising to sampling |
Y |
|
2 |
Making pattern |
Y |
|
3 |
Cutting Pre-production sample |
Y |
Y |
|
4 |
Sewing Pre-production sample |
Y |
|
5 |
Testing Pre-production sample |
Y |
|
6 |
Inspecting Pre-production sample |
Y |
Y |
|
7 |
Sample sent to the buyer |
Y |
Y |
Step 1: Process/Cost centre matrix
The first step Process/Cost centre matrix will chart out which all cost centres (departments) every process involves (encompasses). For example merchandising has various processes like fit sample making, fit sample approval, lab dip making, lab dip approval, Pre-production sample making, etc. Each of these processes can be further divided into micro processes till a clear association with department is established. For example “Pre-production sample making” process can be divided into micro processes where the process and the elements to a process are distinctively defined. For this the following needs to be determined:
Clearly identify the inputs coming into the process and the output that is obtained as a result of the process. For example to make a garment sample the inputs could be the fabric, trims and accessories and the output would be the garment sample meeting the specifications of the customer.
Clearly identify all the people who are involved in the process. For example, in the process of making a garment sample the technical master, merchandiser, tailors, iron man, sourcing staff (if the fabric and trims have been sourced by the sourcing department) are usually involved.
Clearly determine the decisions that are made.
Document such measures as time, cost, space used, waste, accidents or any safety hazards, working conditions, any revenue generation, and quality or customer satisfaction. The above measures are to be measured as appropriate to a process. For example, from the process of sampling, the measure of revenue generation may not be a practical measure but quality/customer satisfaction would be an important measure to document.
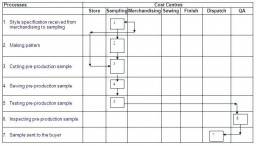
The cost centres indicate the departments from which personnel is responsible for the micro activity. In the above example, we can see cutting of sample involves two cost centres, namely store and sampling. Similarly every process can be associated with one or more cost centres.

Step 2: Mapping the process
A flow chart of activities involved within the process should be clearly depicted. Care should be taken that it is neither too little detailed (so that it doesn’t offer enough details to analyze them further), nor too much detailed (so that it becomes unperceivable for the analysts). The key activities and decisions should be identified and represented. This is also called key process map. Key process map means making process dependency network diagram incorporating cost centres. This step tries to establish link with the micro processes. The links are depicted with arrows showing the flow of material and information. While making the key process map we have to ensure that all arrows have predecessor and successor. Every process should start and culminate to another process. There can be more than one predecessor or successor for one process.
Step 3: Analyzing the process
During the analysis of the process, some important questions need to be pondered upon.
Is the flow of activities in the process logical?
Are there any steps which need to be introduced?
Are there any steps due to absence of which problems are being encountered?
Are there any steps which can be eliminated?
Does the step add value to the process?
Does any waste occur at this step?
Could the time to perform the step be shortened?
Could the cost to perform the step be reduced?
Could few steps be combined?
For analyzing the process for potential improvement, several techniques can be used by organizations like brainstorming, benchmarking, Hoshin Kanri and Pareto Analysis.
Brainstorming

Brainstorming is a group technique used to generate a free flow of ideas quickly in a group of people and it may be used in a variety of situations. Each member of the group is encouraged to put forward his or her idea with regard to the problem being considered. All kinds of ideas are welcomed and no criticism or evaluation occurs during brainstorming. All ideas are recorded for subsequent analysis. The process of idea generation continues until no further ideas are forthcoming. Brainstorming increases the chance of getting an innovative solution to a problem being encountered while running a process. It can be used to identify the problem areas and the areas for improvement, to design solutions to problems and to develop action plans.
Benchmarking
Benchmarking is the process of measuring the productivity, cost and quality of a product against the best in the same or other industry. Benchmarking will provide a clear picture to an organization where it stands in comparison to its competitors. Thus it helps an organization see its operational efficiency and effectiveness in the environment that it operates in. This process improvement technique will enable an organization to strive harder and improve the overall productivity and quality standards, so that they can beat the best standards.
Hoshin Kanri
Hoshin Kanri is a process improvement technique that unites an organization to reach a single goal. There are four aspects that are concentrated upon in this process improvement technique:
The organization sets a single goal that it wants to achieve in a time-frame.
When the goal is determined, it is conveyed and communicated to all the leaders in the organization.
The leaders then plan and brainstorm different ways on how to achieve the goal that was set to attain. Each department sets its own objectives, properly aligned to the organizational goal.
The whole organization then joins hands and makes concerted efforts with the aim to achieve its goal.

Pareto Analysis
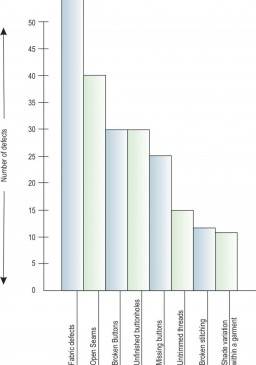
Pareto Analysis is the technique for classifying problem areas according to degree of importance and focusing on the most important ones. It can be used to analyze the ideas collected from a brainstorming session. It is used to identify the few vital problems or causes of problems that have the greatest impact. A Pareto diagram or chart pictorially represents data in the form of a ranked bar chart that shows the frequency of occurrence of items in descending order. Usually, Pareto diagrams reveal that 80% of the problems are attributed to 20% of the causes; hence, it is some-times known as the 80-20 rule. A typical Pareto chart is depicted below:
As it’s clear from the chart, two most troublemaking areas are the fabric defects and open seam in the entire sewing process. Once the areas have been identified, production and quality team can concentrate on these areas to make sure that they are not got away with.
Step 4: Redesigning the process
The detailed, step-by-step analysis of the process will provide some insights into the entire process. Using these insights and information the process should be redesigned. Thus, we can say that process improvement is basically a method of solving problems. If there is an apparent or lateral problem, the processes involved need to be analyzed in detail so that they can be improved, leading to the solution to the problem. For example, if buyers have been rejecting the samples one after another citing different issues, there is definitely a problem in the process of making the samples. A detailed analysis of each steps of the process would help identify the sampling team where the problem lies. Once the problem areas are identified, they can be corrected, thus redesigning the problem.
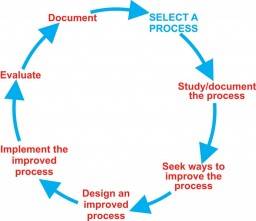
On the basis of the above discussion the process improvement cycle can be presented as shown below.
Process improvement methods can be used at the organizational level to improve the overall operations of an organization. The usage of these process improvement techniques depends greatly on the long- and short-term objectives/goals of the organization. In process improvement, a company seeks to learn the causes of loss of productivity, quality, and efficiency in the various departments of the organization. The causes found after in-depth study and observation are then analyzed, and the right process improvement technique is used to set the problems right.
Conclusion
After re-designing the process the process/cost centre matrix is developed again to see which department is involved in which process and accordingly the information can be used for calculating departmental workload, ABC costing and further improvement, which is Kaizen.

Leave a Reply